Deciding to use disposable caging systems may appear as an obvious choice when faced with challenges related to decontamination and cleaning in units where hazardous compounds or agents are used.
Common examples are: infectious or parasitic agents, highly toxic chemicals (such as carcinogenic, mutagenic or reprotoxic substances), radiolabelled test compounds with urine and fecal elimination.
In other situations, the decision making may appear more complex. Relying on a multi-parameter comparative analysis, decision makers can take into account: costs, manpower, operational constraints and complexity, cross contamination risk, etc.
| Examples of costs and constraints to be included in the comparative analysis | ||
|---|---|---|
| Transport and handling costs | Purchases / consumable costs | |
Although sketch-based analysis is not acceptable alone as a decision-making tool, it provides numerous benefits to managerial discussions and communication. Visualization through drawing helps to map out concepts, understand how a system works, and to comprehend large amounts of data.
This paper presents a comparative sketch-based analysis of “disposable vs. reusable cages” applied to a satellite site having no washing resources.
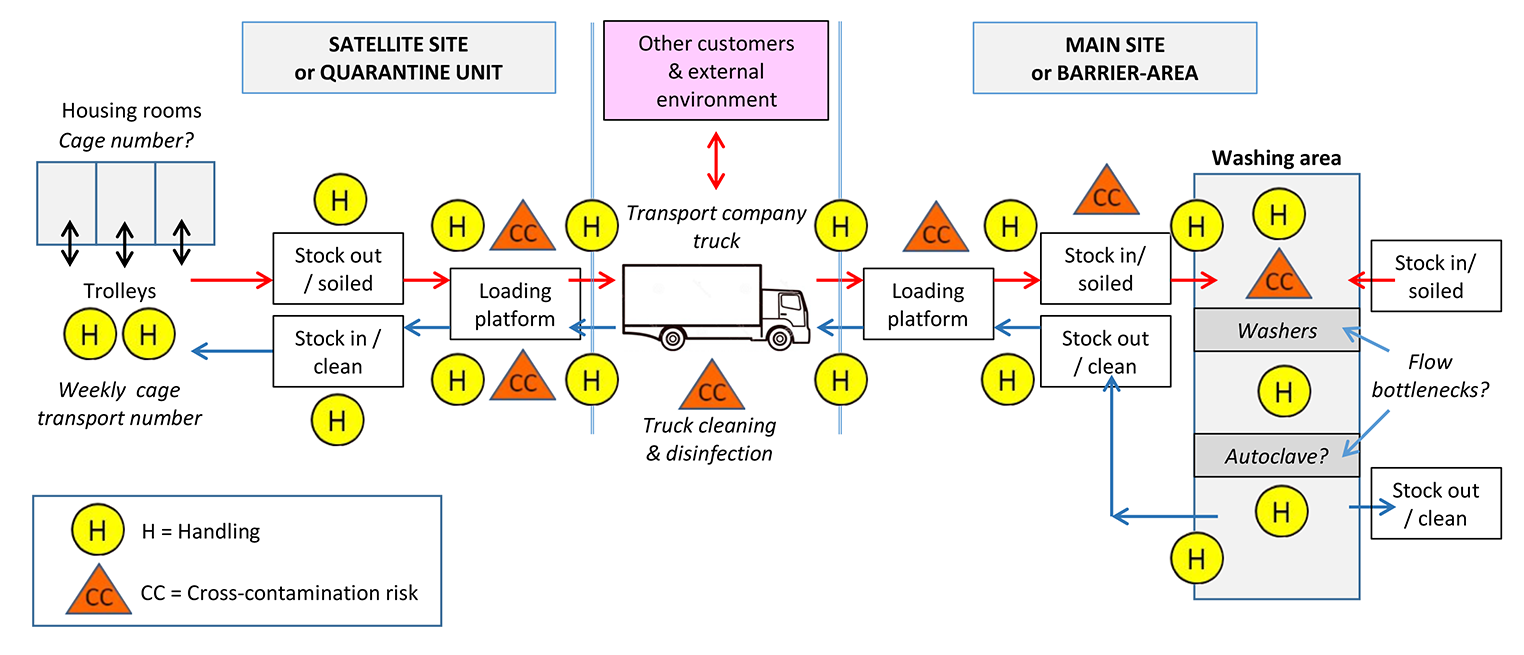
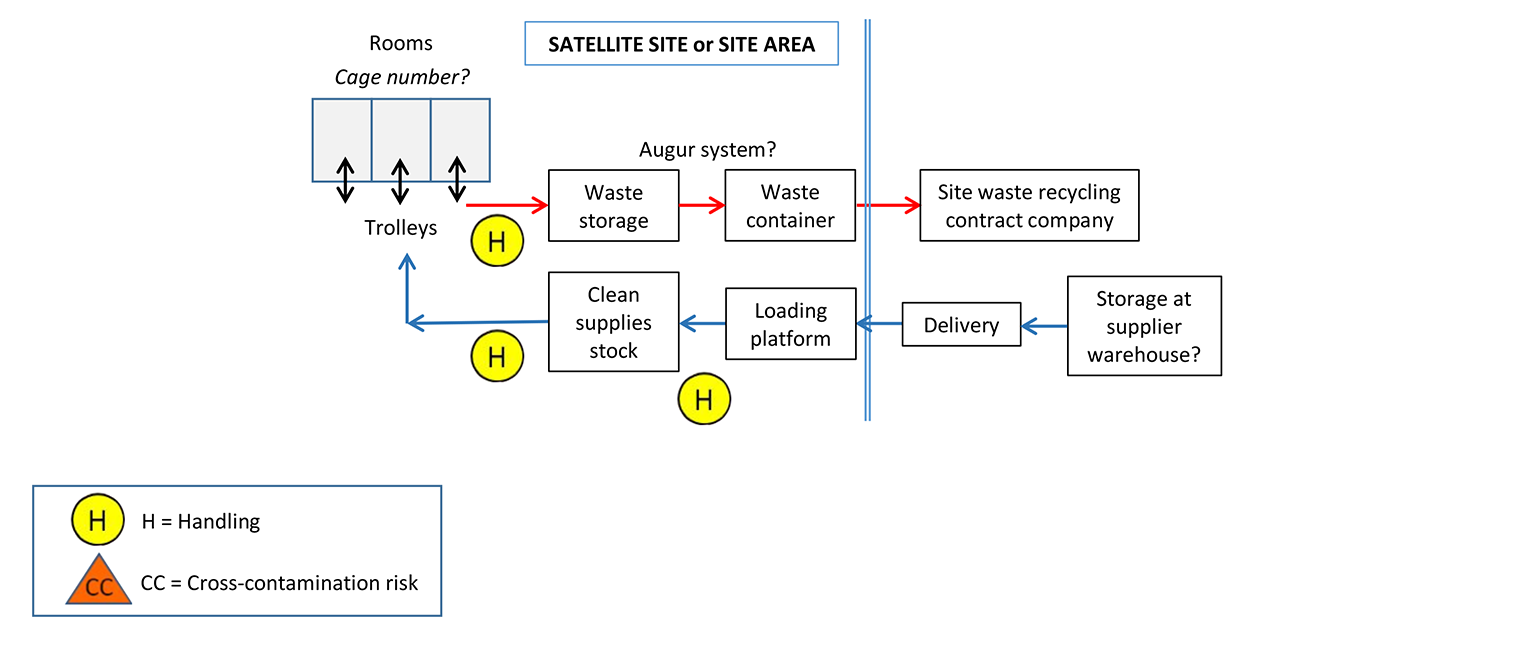
The visual analysis presented is based on two decision-making parameters – cross-contamination risk and number of handling steps. This data would be complemented with additional information, such as costs at each step. But, let this serve as an overview:
Option 1 – Satellite site management with reusable cages

Option 2 – Satellite site management with disposable cages

Figure 1 – Option 1 – Satellite site management with reusable cages, requiring transportation to and from the main site where the washing area is located. The yellow and orange tags indicate the numerous handling steps and cross-contamination risk situations
Figure 2 – Option 2 – Satellite site management with reusable cages and no transportation to and from the main site. They are replaced by clean disposable supplies, and waste removal with separate flows. The yellow tags indicate the few handling steps, and cross-contamination risk situation.
Formalizing flows and all steps involved in one drawing is extremely useful for decision makers. It helps to better visualize the differences between two potential options, to grasp their respective complexity, the operational impacts and to identify all critical steps.
Another step is adding ”warning tags” to the flows, in order to better reveal the number or criticality of steps. In this example, yellow tags indicate a handling step by personnel and orange tags signifies a risk of cross-contamination.
Lastly, decision makers can compare the tagged drawings representing the two options.

